What’s new in Version 4?
Reports
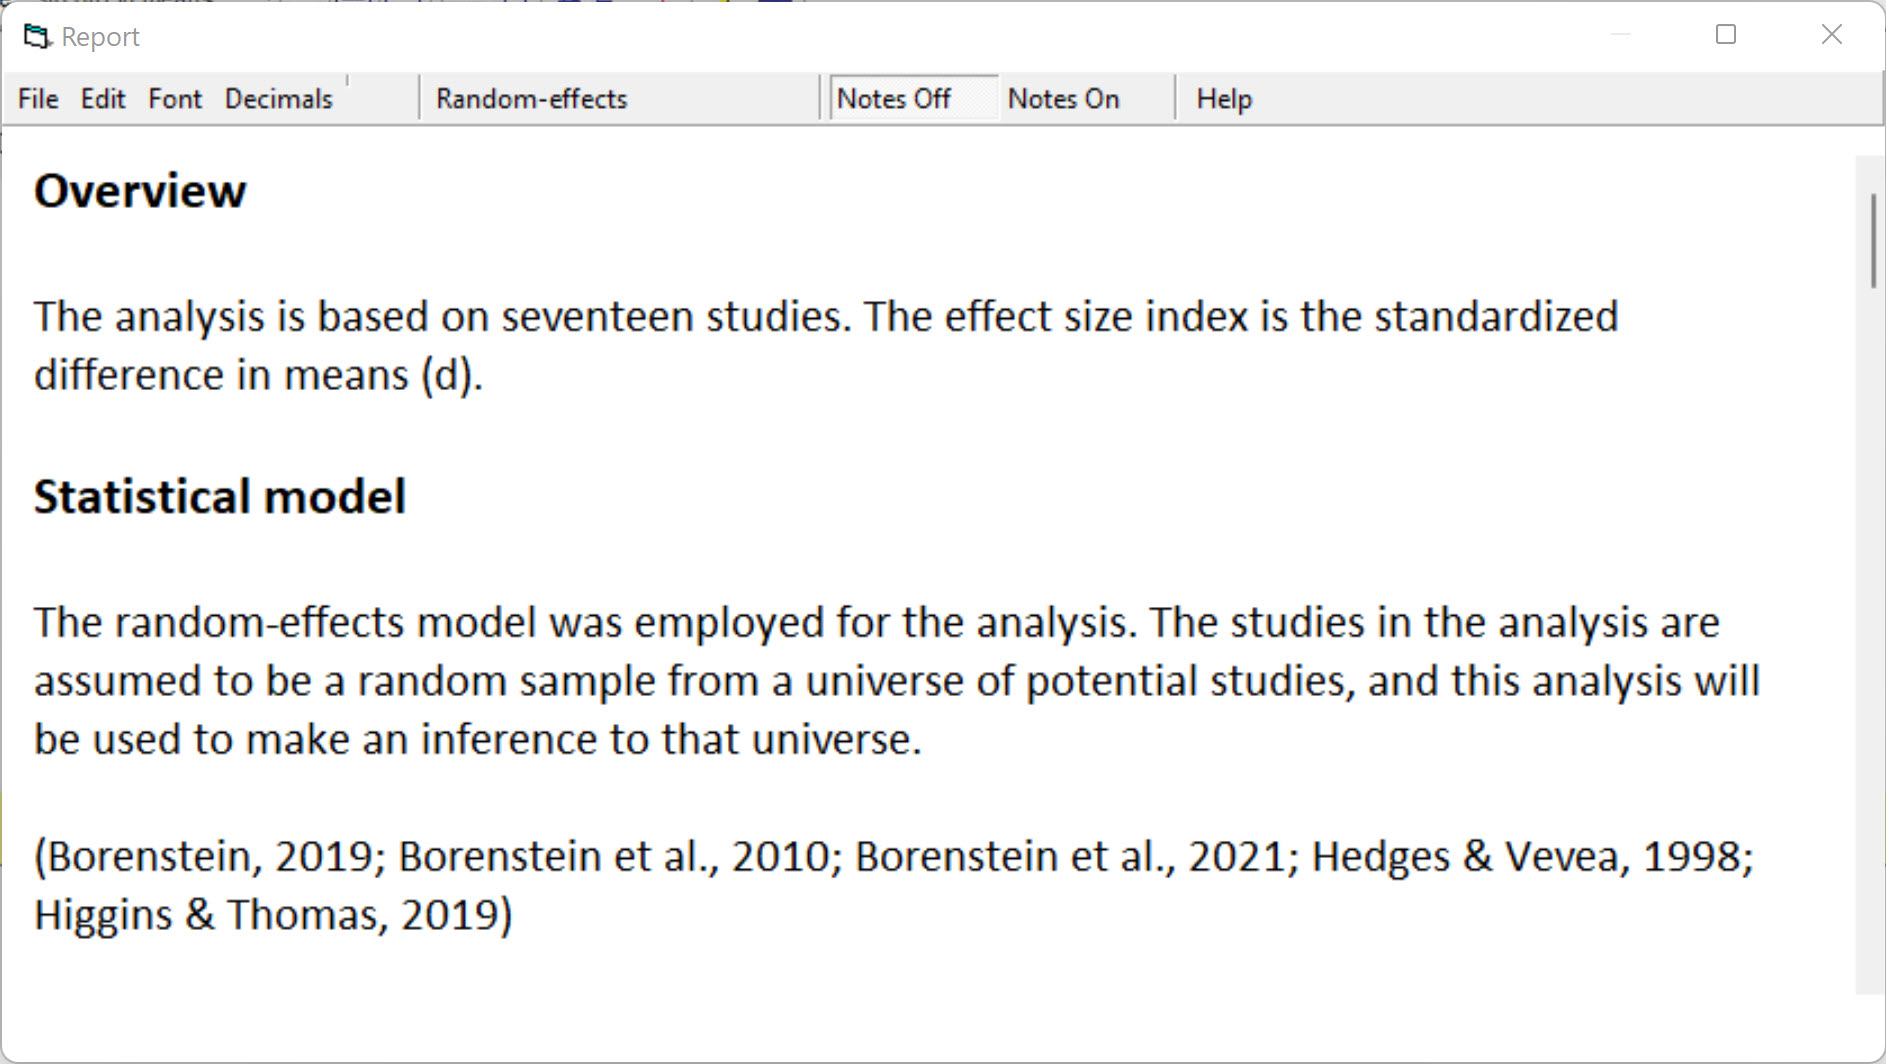
With one click the program will create a document that reports all statistics in a format that is suitable for publication.
With a second click the program will annotate this document and explain the meaning of all statistics as well as assumptions and limitations
With a third click the program will export this document to Word
For a sample report, click here.
Video tutorials
We have developed videos of case studies that show how to run an analysis from start to finish. This includes how to enter data, how to run the analysis, how to create plots, how to compare the effect size in different subgroups, and so on.
Critically, each section of the video explains now only how to perform specific functions, but what purpose these functions serve in the context of the analysis, and how to understand the meaning of the statistics.
Each case study runs about ninety minutes. You can watch one from start to finish to learn how to perform a meta-analysis and report it properly. Or, from any screen in the program you can jump to the part of the video that explains all functions on that screen.

Prediction Intervals
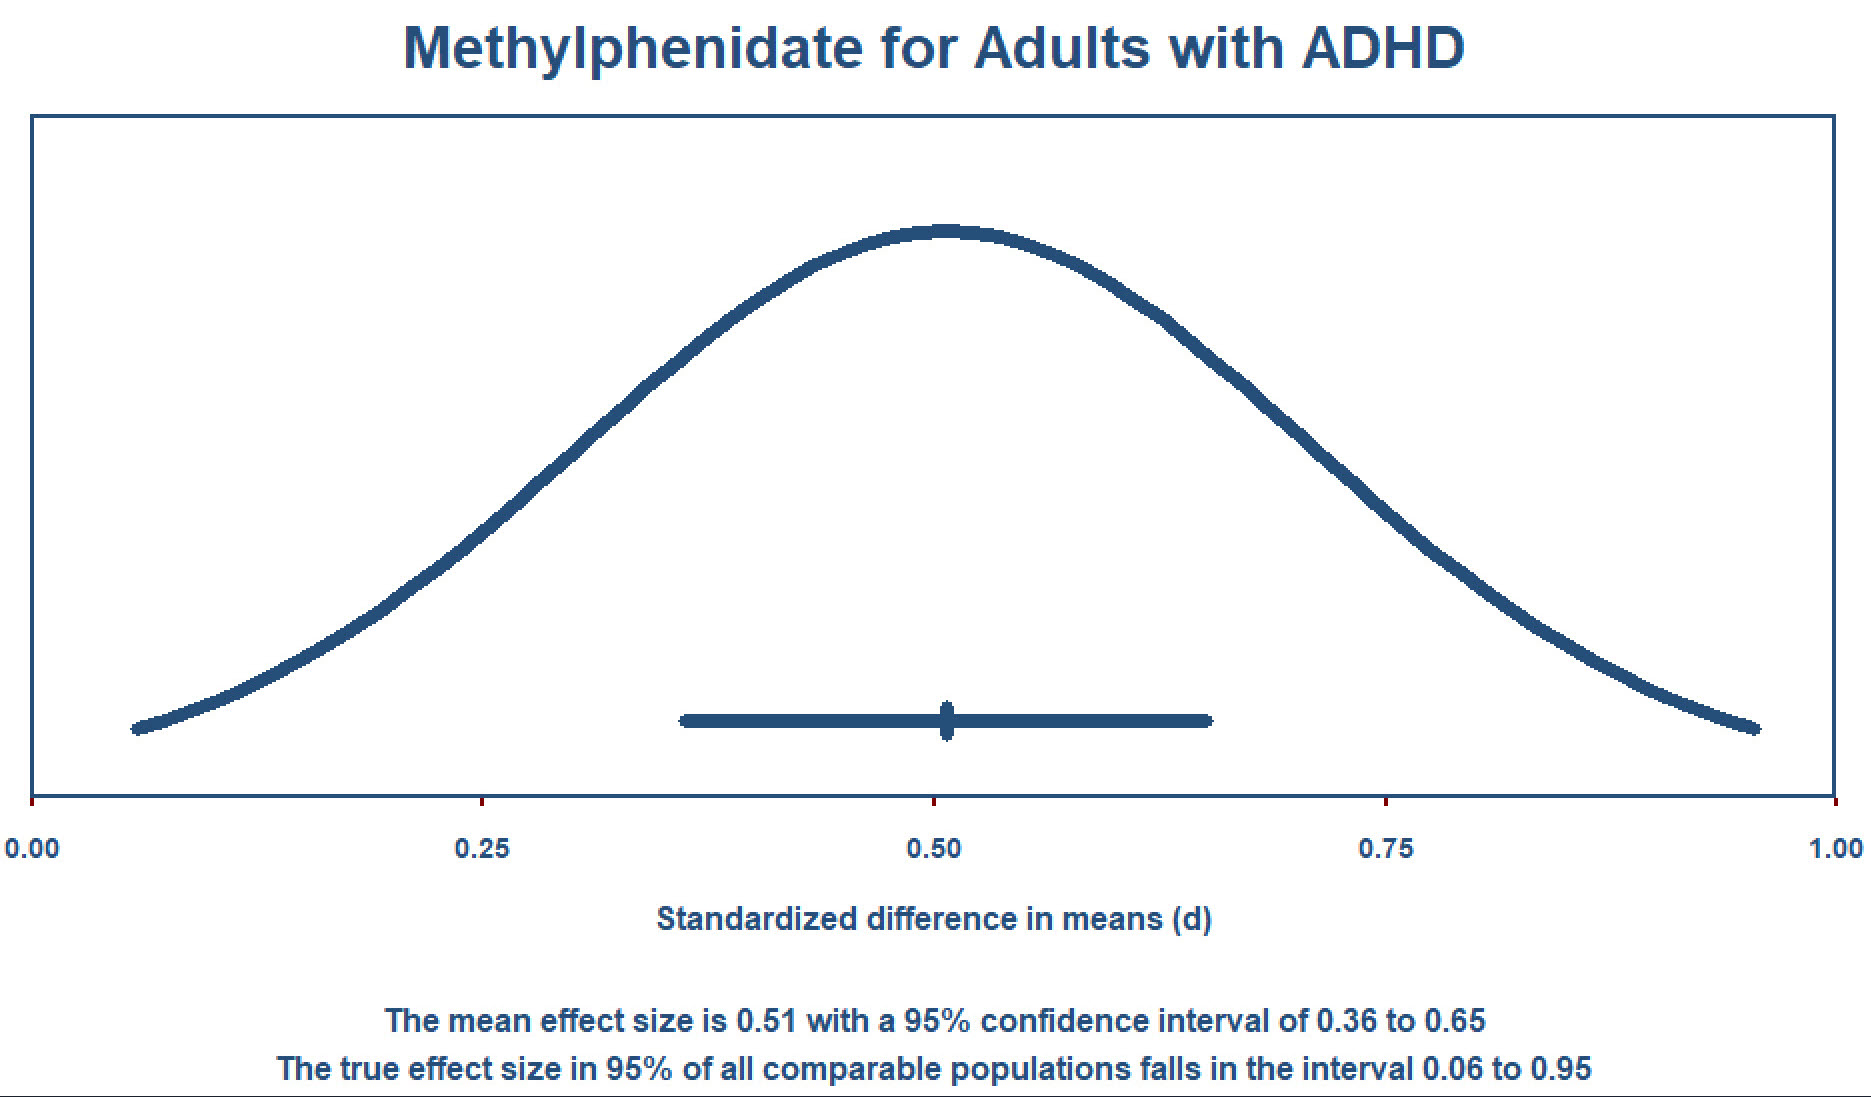
In any meta-analysis it is important to report the mean effect size and also how widely the effect size varies across studies. This dispersion is addressed by the prediction interval. This allows us to report, for example, that the mean effect size is a standardized mean difference of 0.50 but that in any single population the true effect size could be as low as 0.05 or as high as 0.95. Many guidelines for reporting a meta-analysis now request the inclusion of prediction intervals.
In Version 4 the program offers the option to display the prediction interval as part of the forest plot. Additionally, with one click you can create a plot that shows the entire distribution of true effects. With one more click you can export this to Word or PowerPoint.
Common Mistakes and How to Avoid Them
We recently published a book called Common Mistakes in Meta-Analysis and How to Avoid Them
This book includes mistakes in such areas as choosing a statistical model, statistics related to heterogeneity, comparing subgroups of studies, publication bias, and more.
From any screen in the program, you can click a link that will open a PDF with the relevant sections of the book.
Comprehensive Meta-Analysis
Comprehensive Meta-Analysis (CMA) is a powerful computer program for meta-analysis. The program combines ease of use with a wide array of computational options and sophisticated graphics.